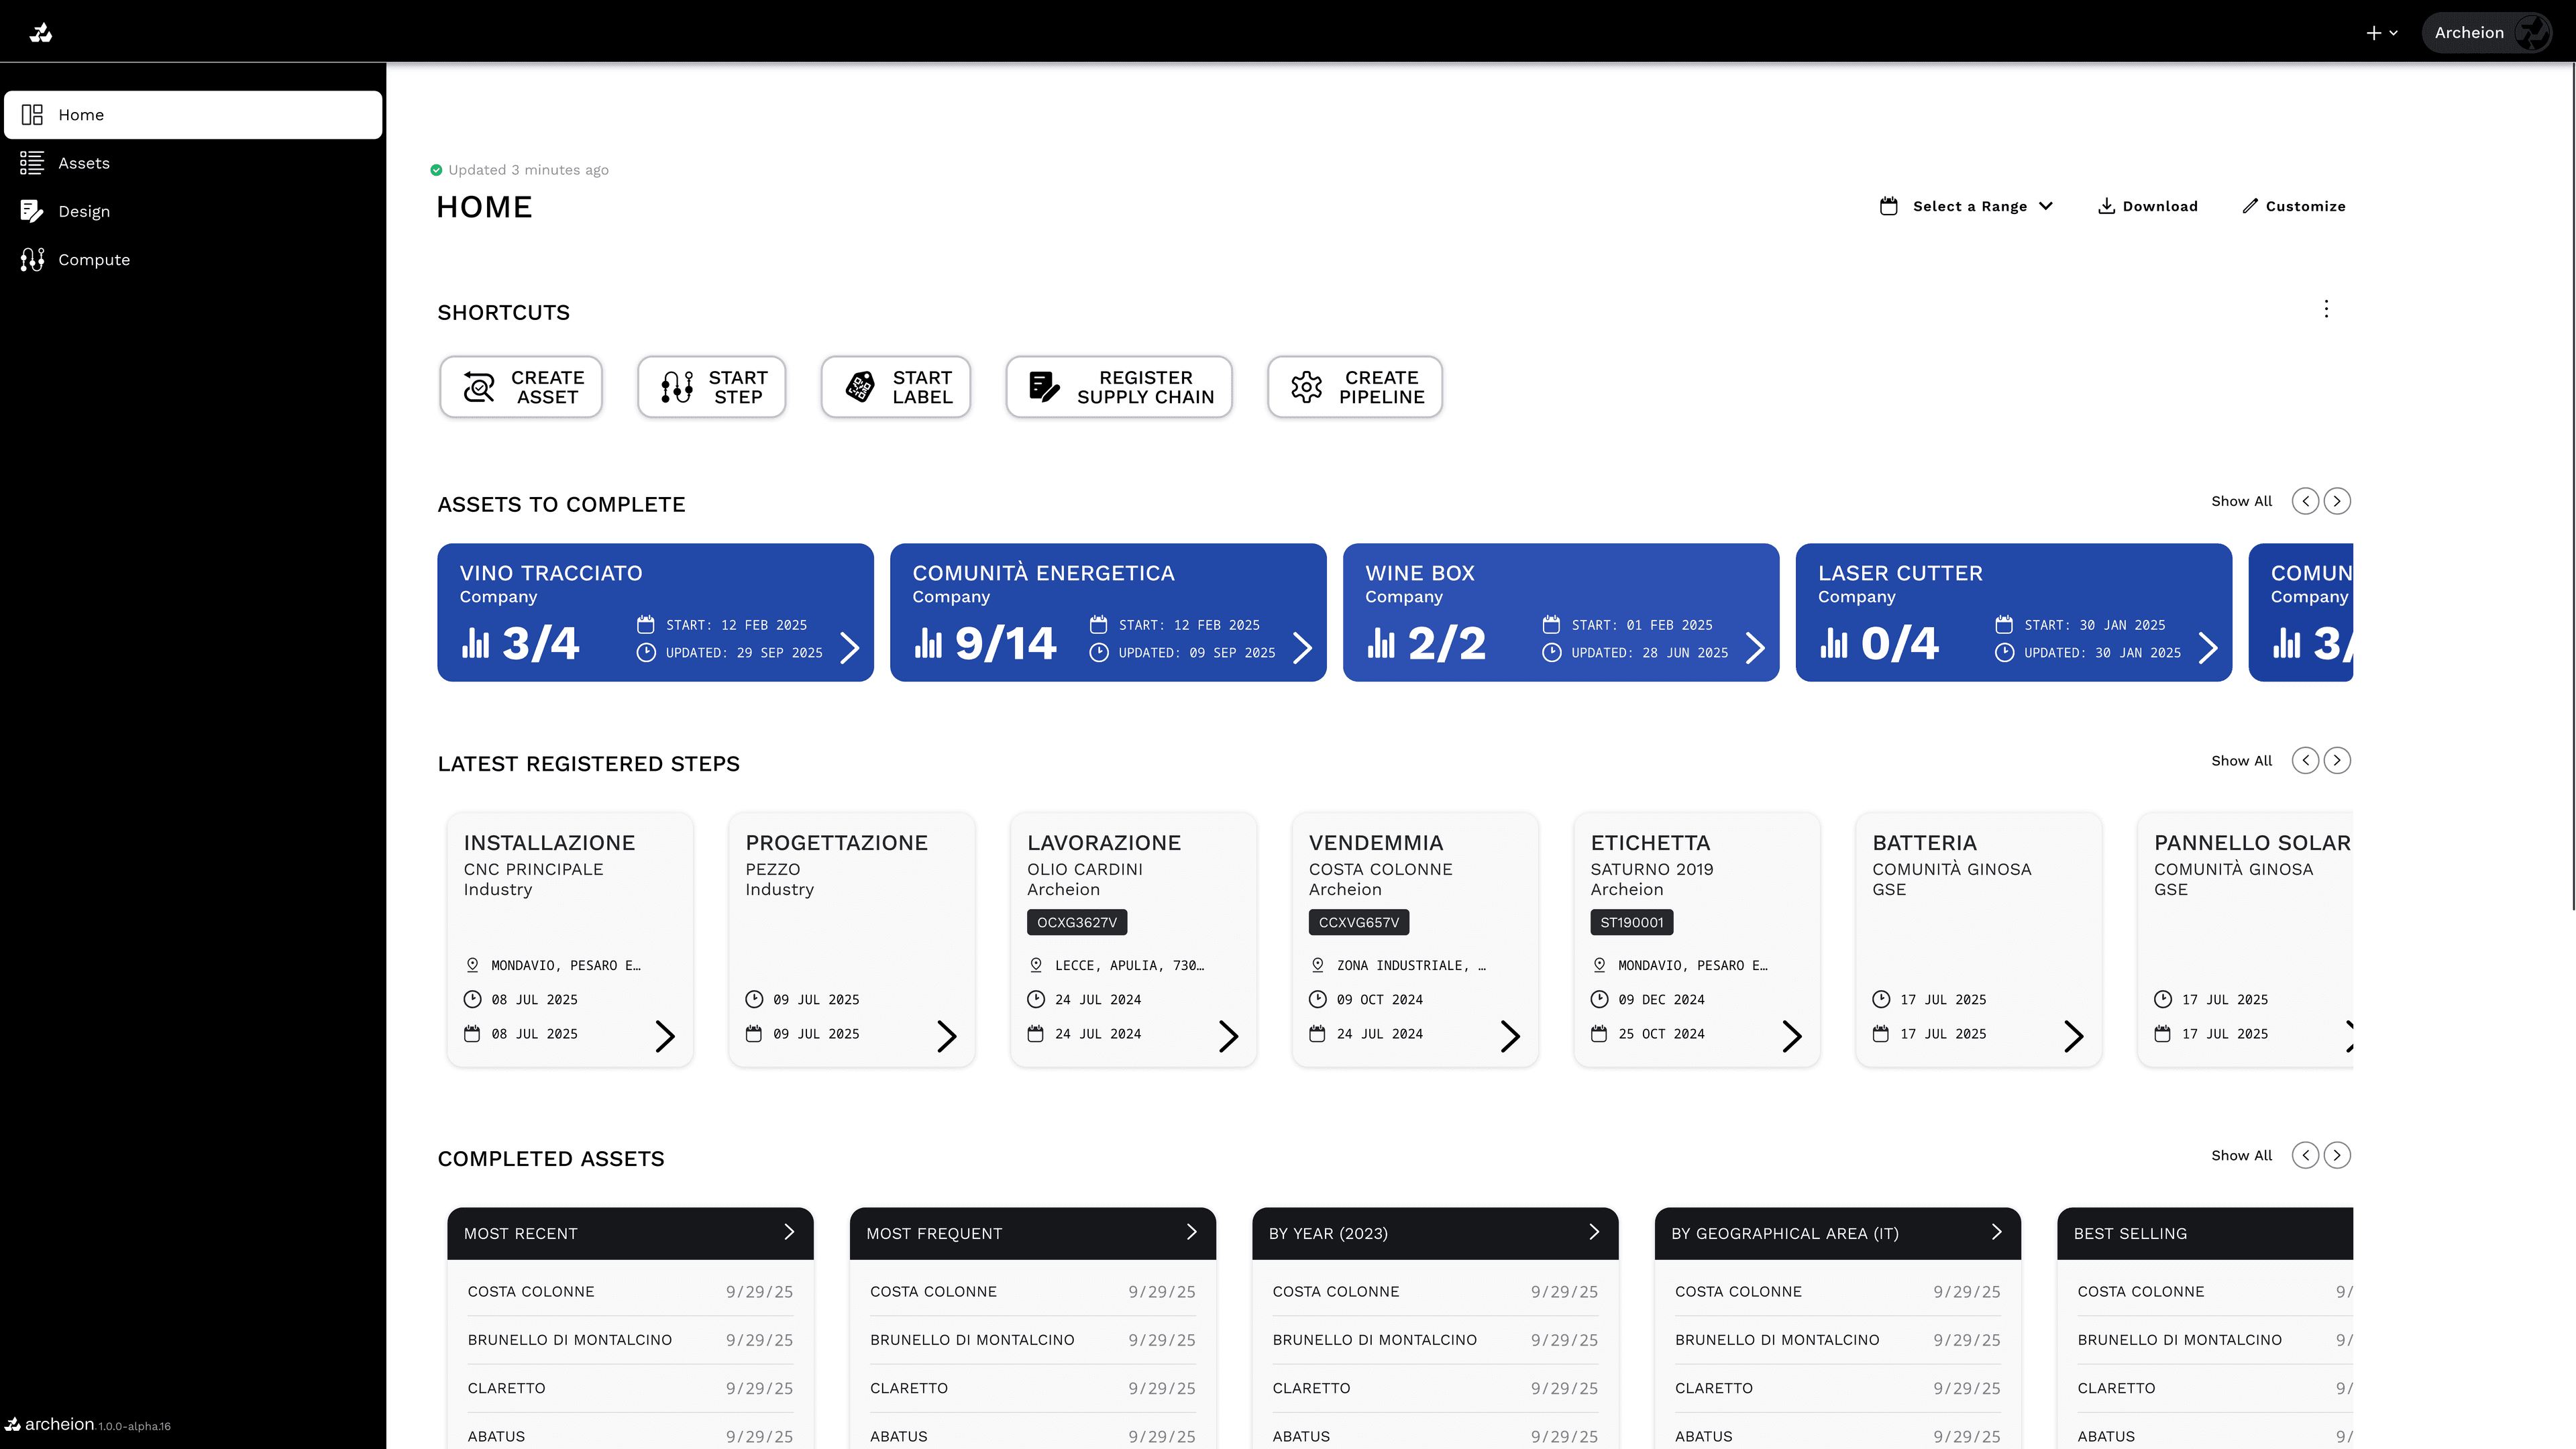
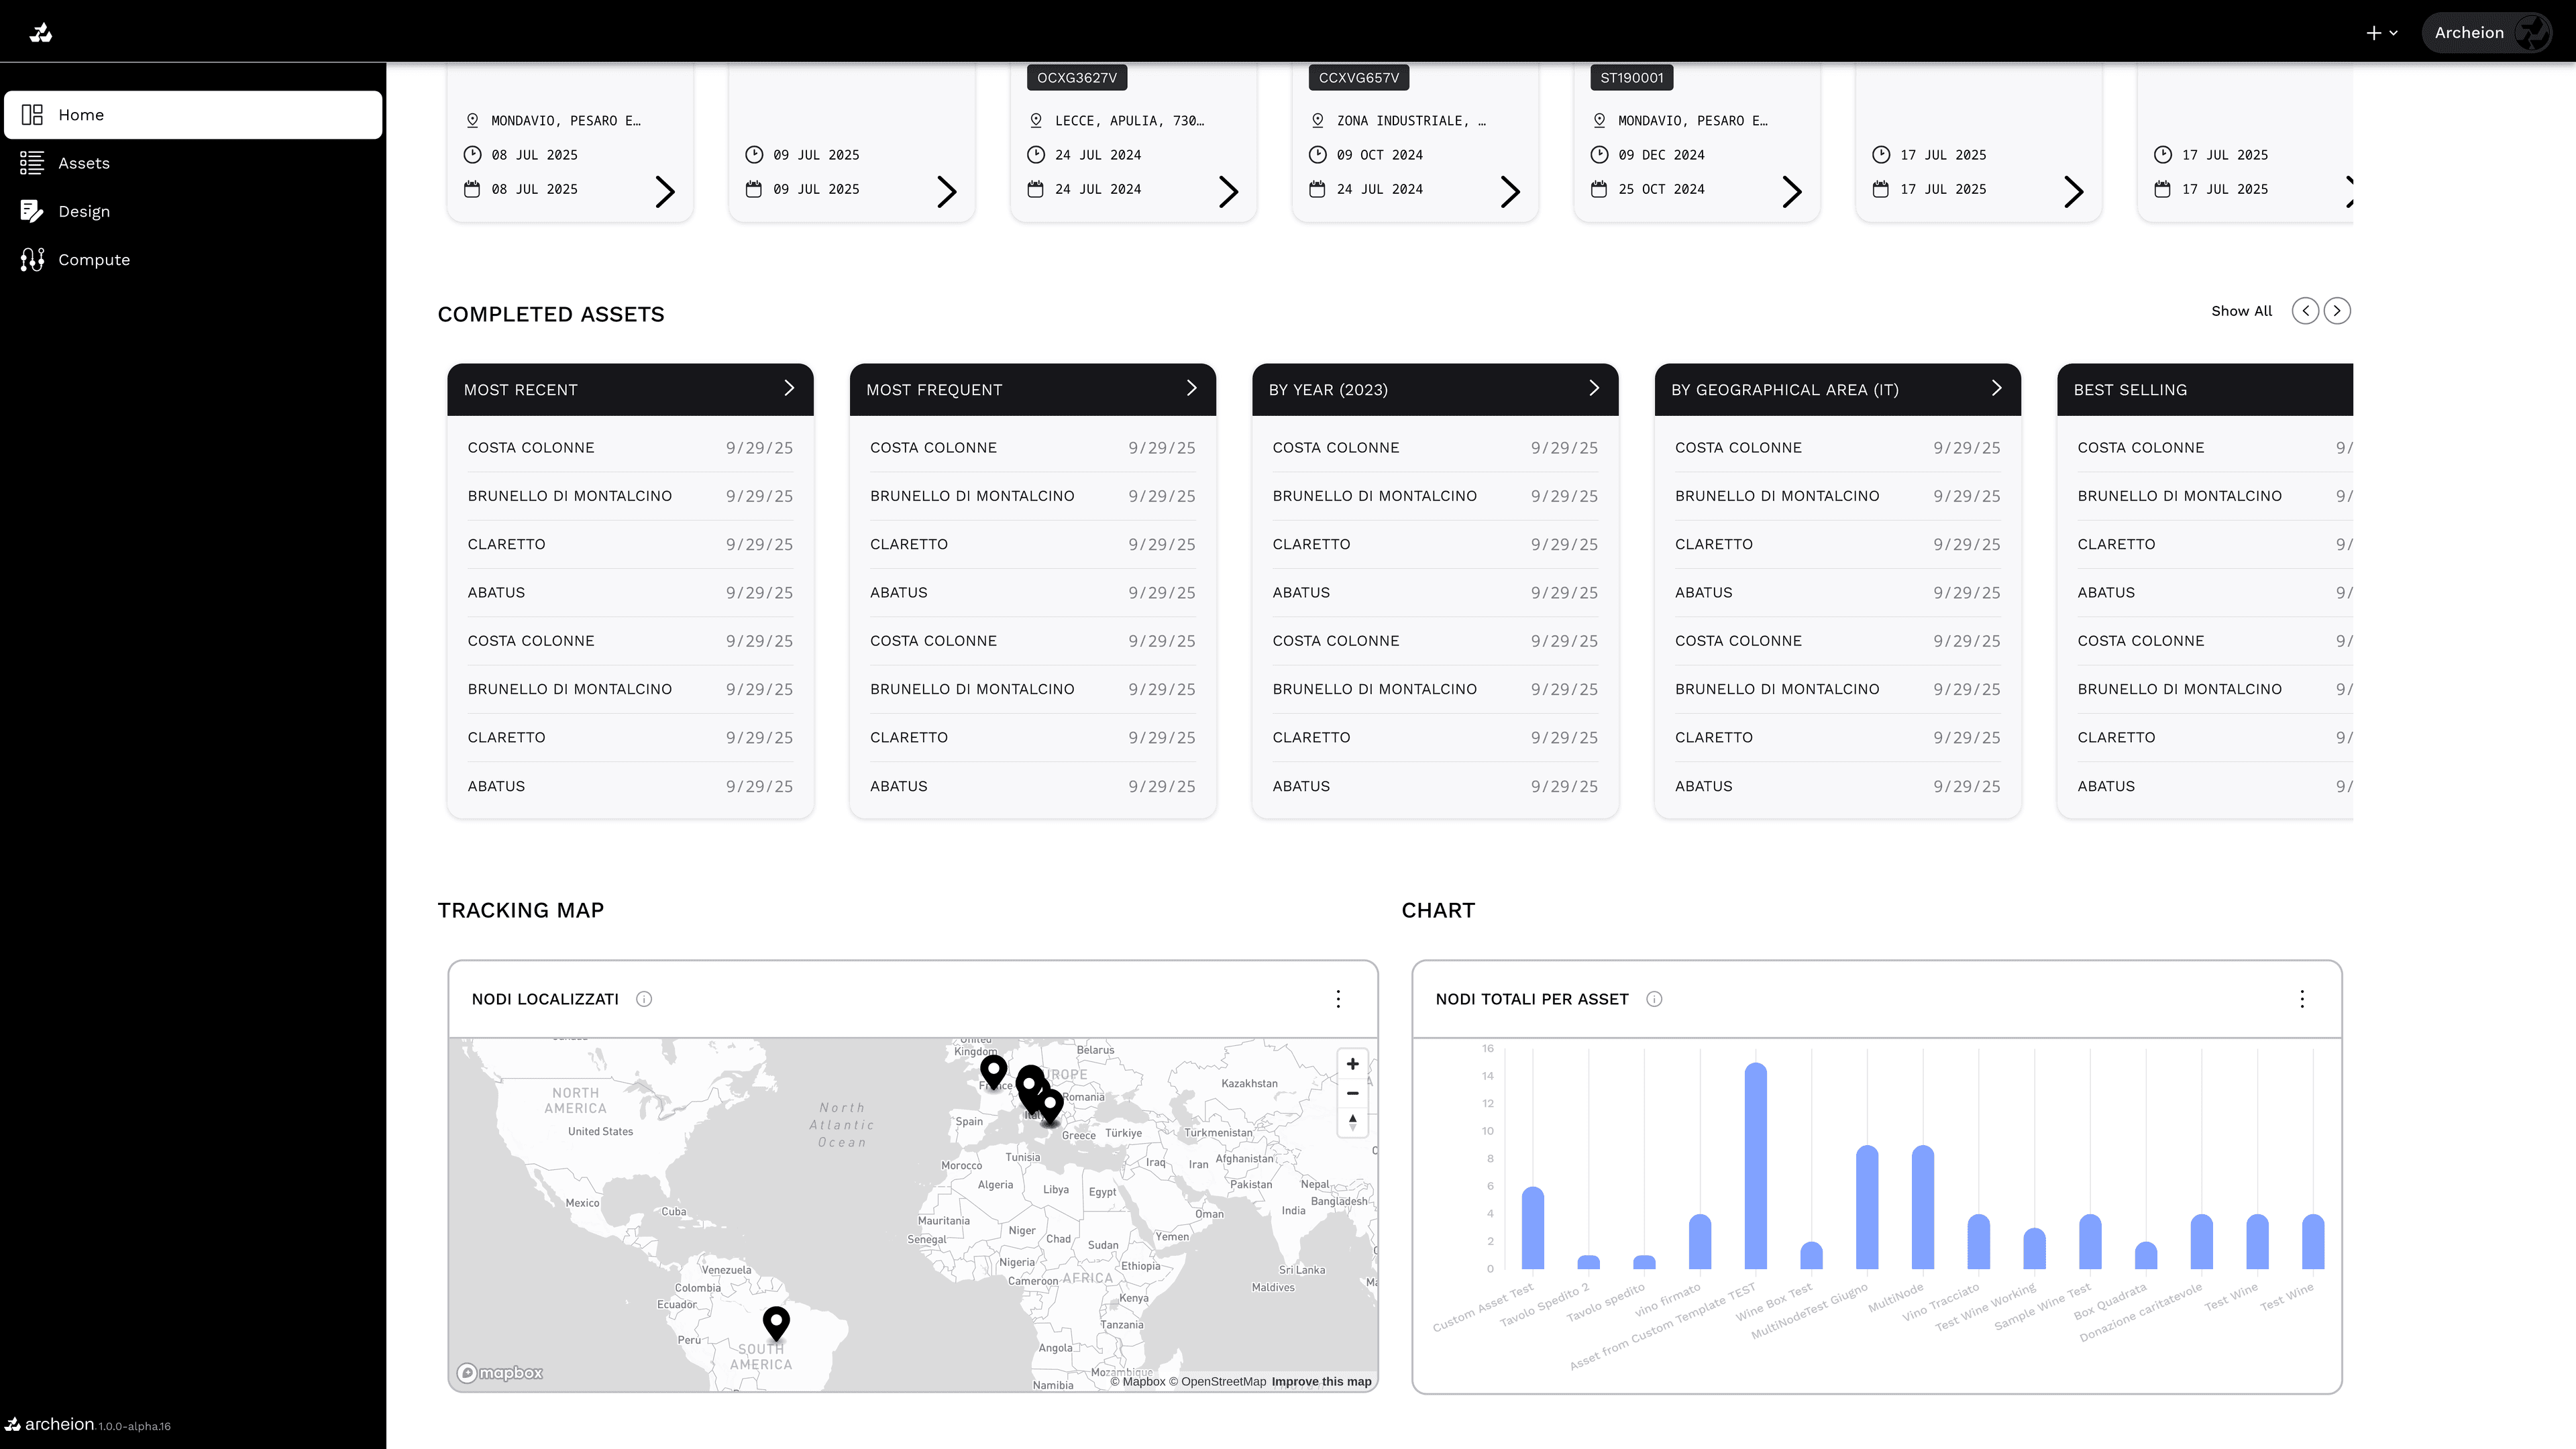
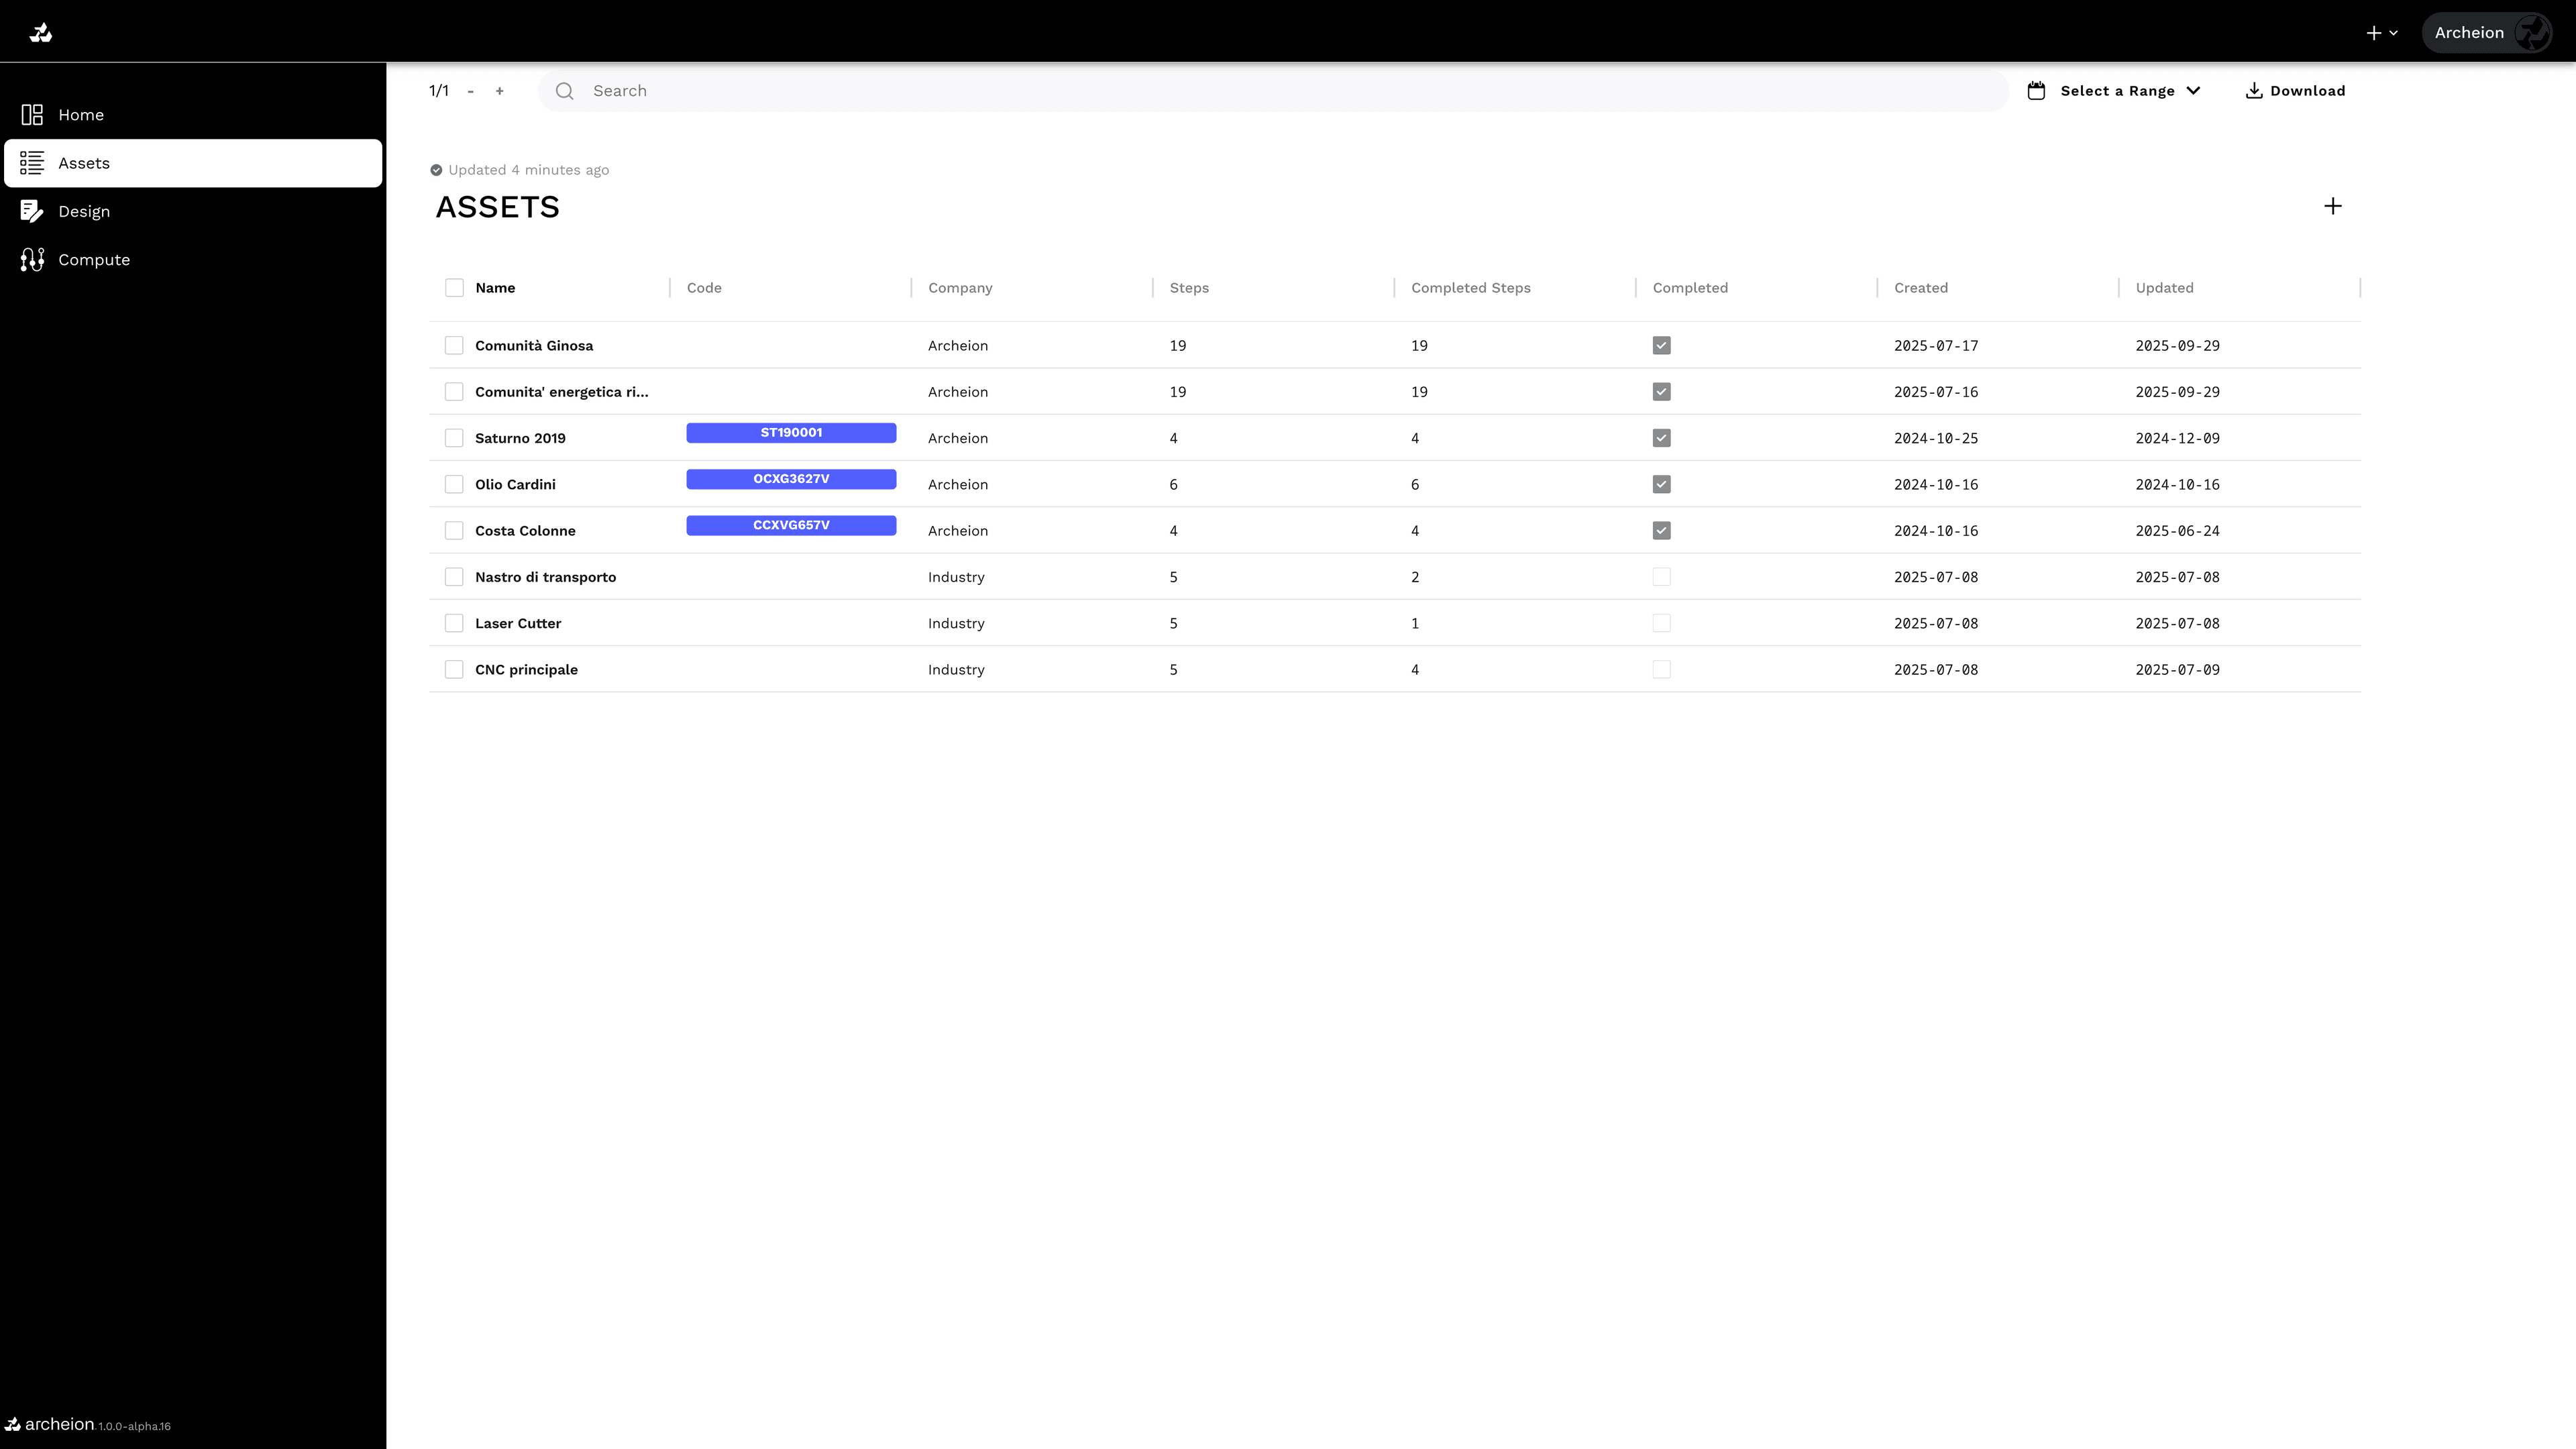
The dashboard provides a comprehensive, real-time overview of all active assets and processes. Through a centralized interface, users can create new assets, launch pipelines, and monitor progress with key performance indicators always visible. Data is dynamically aggregated, with visualizations including recent step timelines, geographical node mapping, and distribution charts, ensuring immediate control over the supply chain and operational performance.
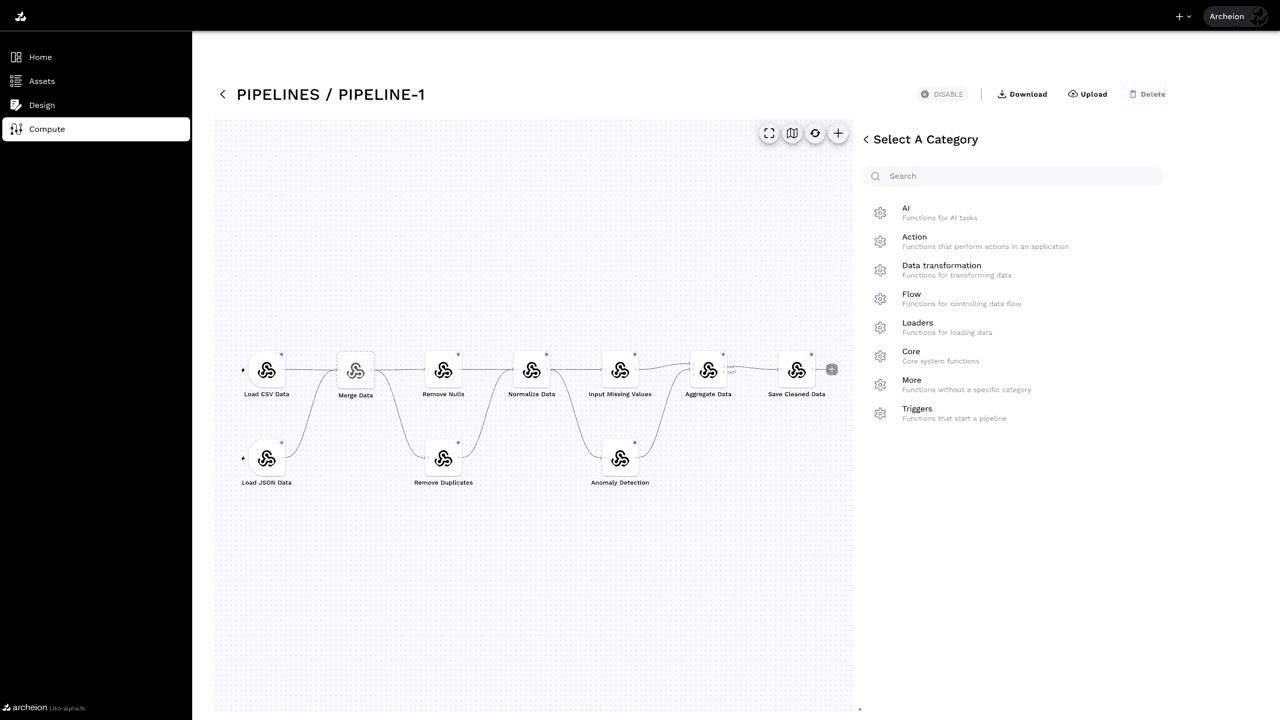
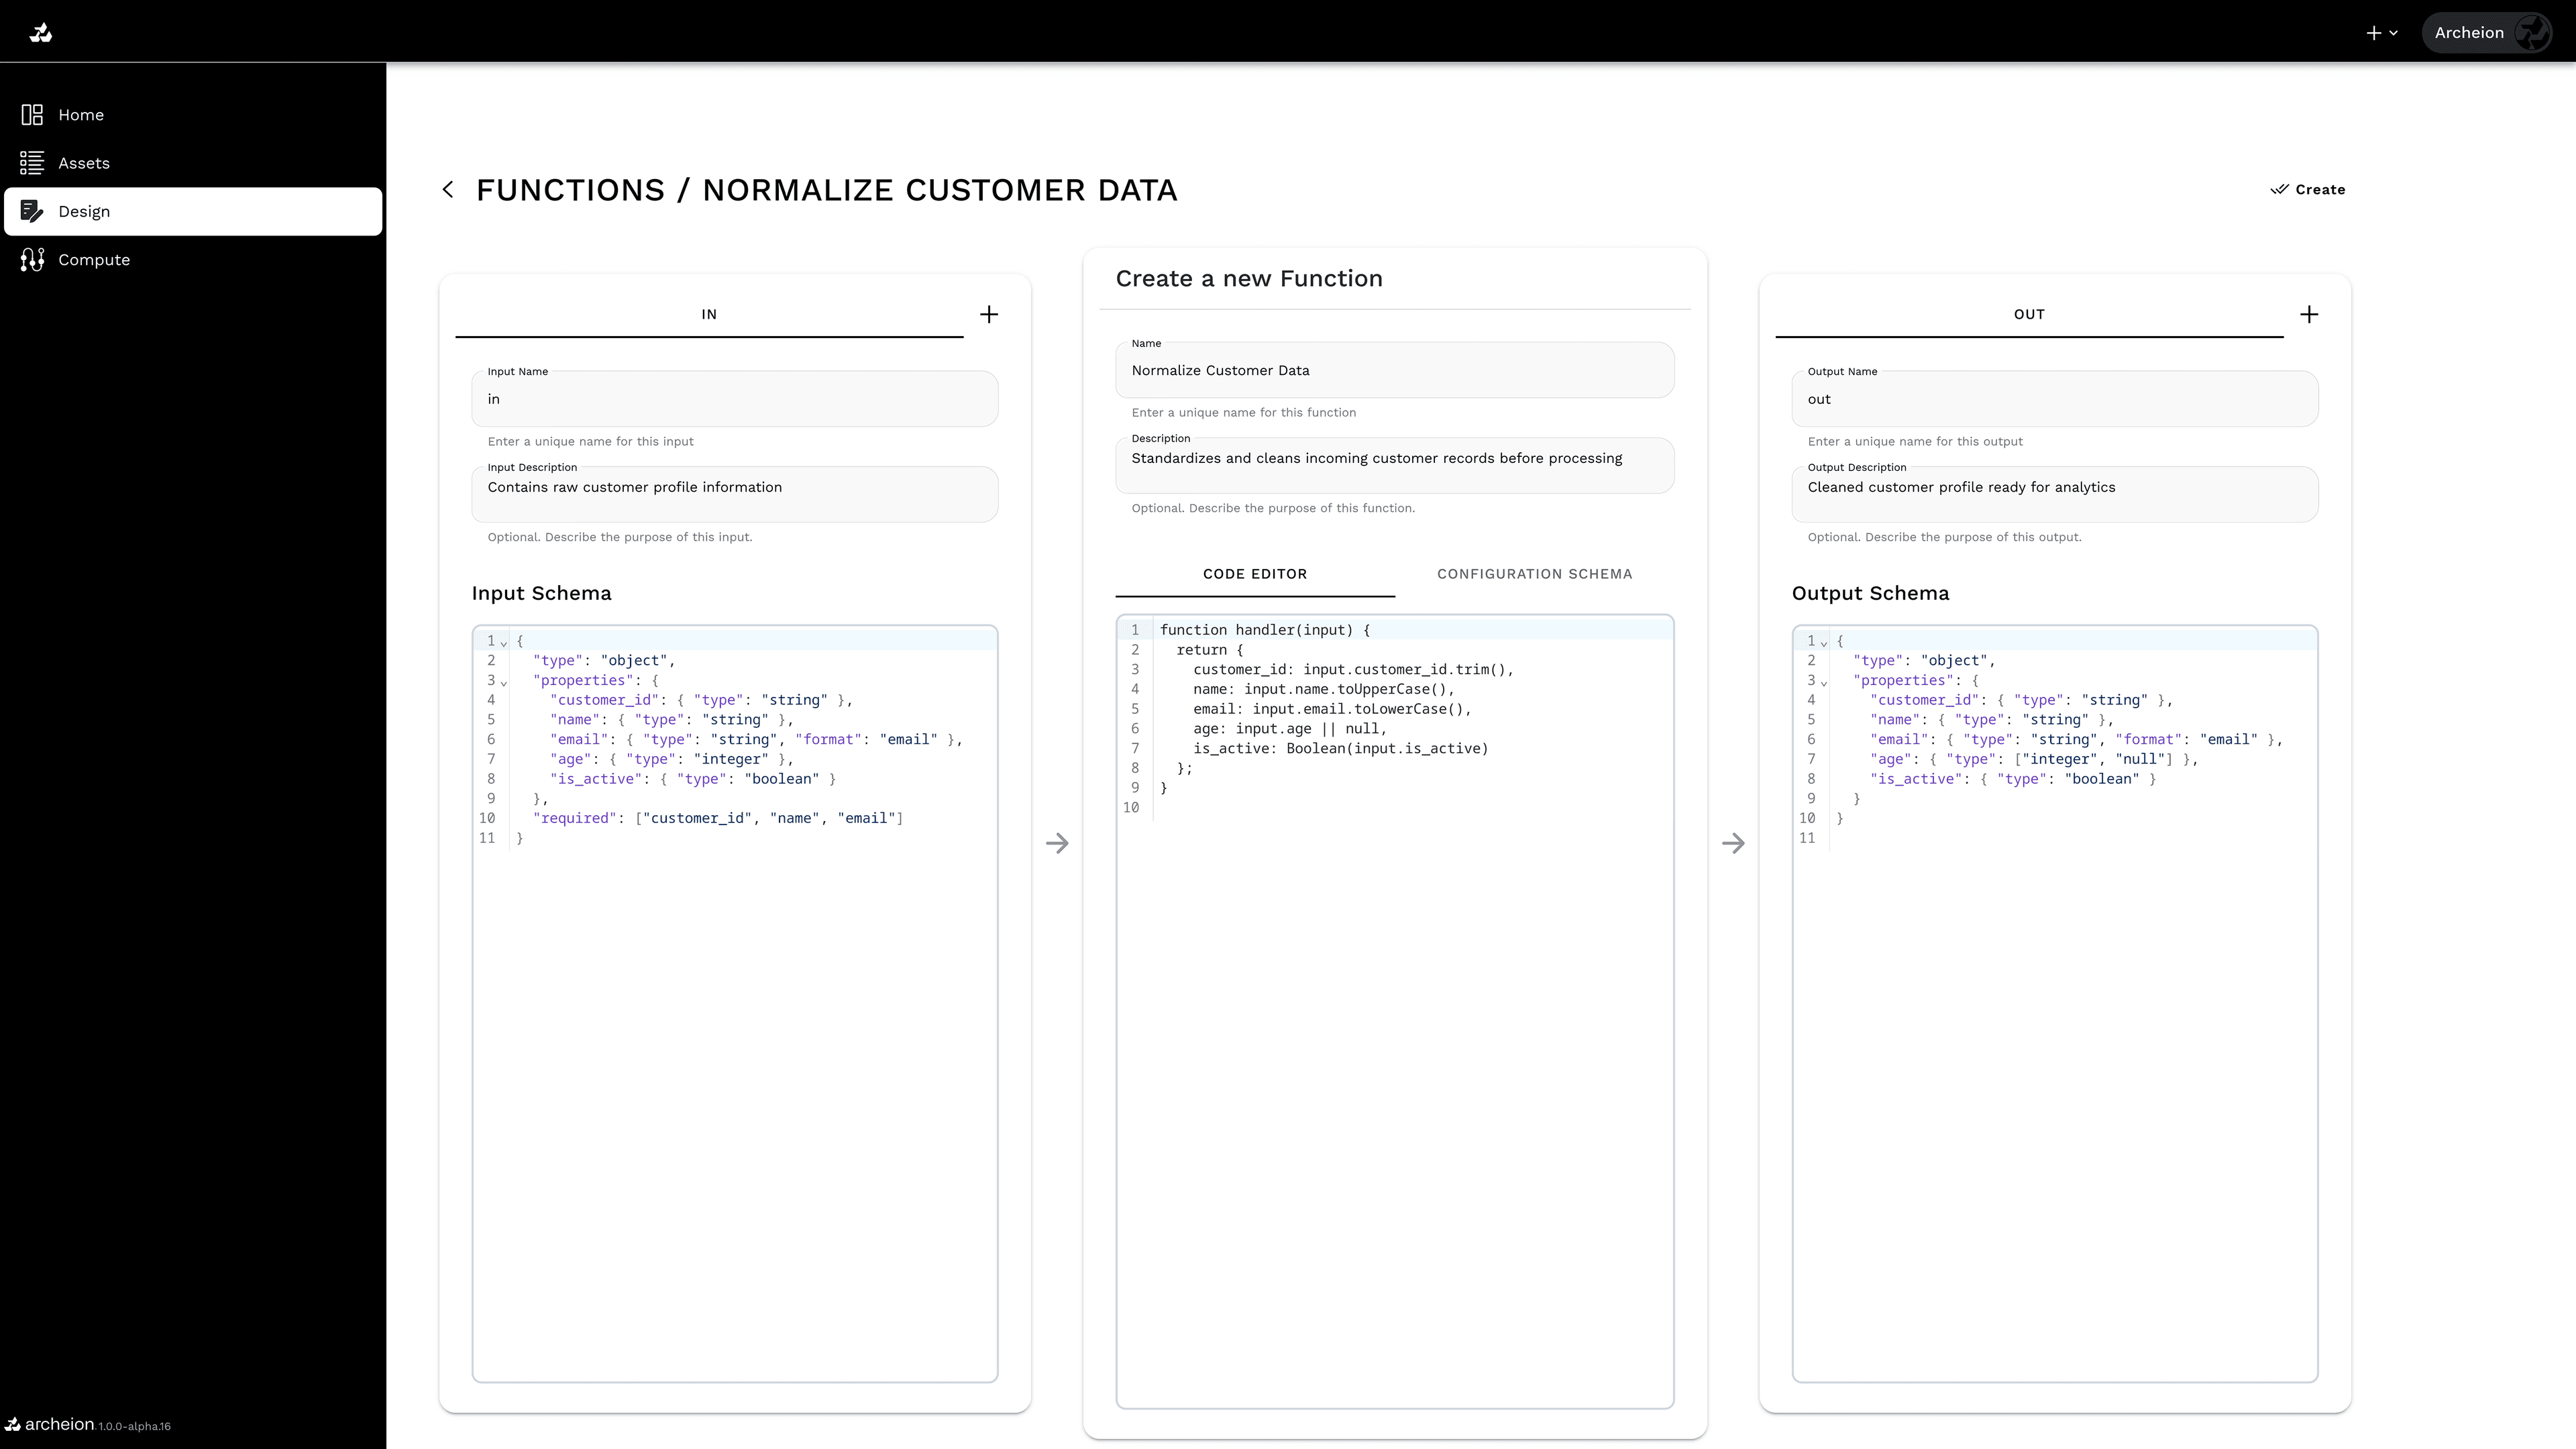
The pipeline editor allows the design of complex workflows through a drag-and-drop visual interface, enabling the combination of data loading, transformation, and analysis functions without the need for code. Each node in the flow represents a specific operation, such as normalization, duplicate removal, or anomaly detection, and is connected in sequence to ensure scalable and repeatable processing. Users can configure, save, and execute customized pipelines, optimizing the entire data processing lifecycle.
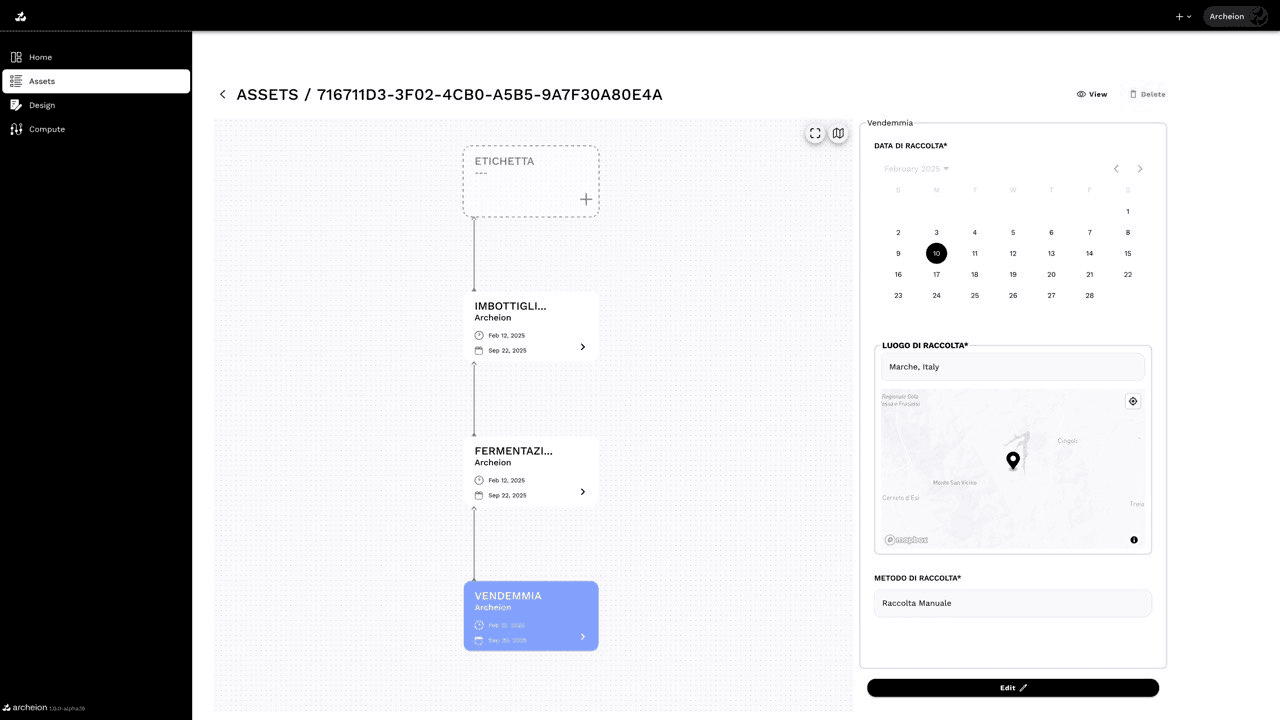
The asset detail section provides a visual representation of the product lifecycle, clearly linking every stage of production and transformation. Each step is tracked with dates, involved stakeholders, and geographical location, while associated metadata accurately describes operational details such as harvesting techniques or processing methods. This structure ensures full traceability of the product, guaranteeing transparency and reliability throughout the entire supply chain.
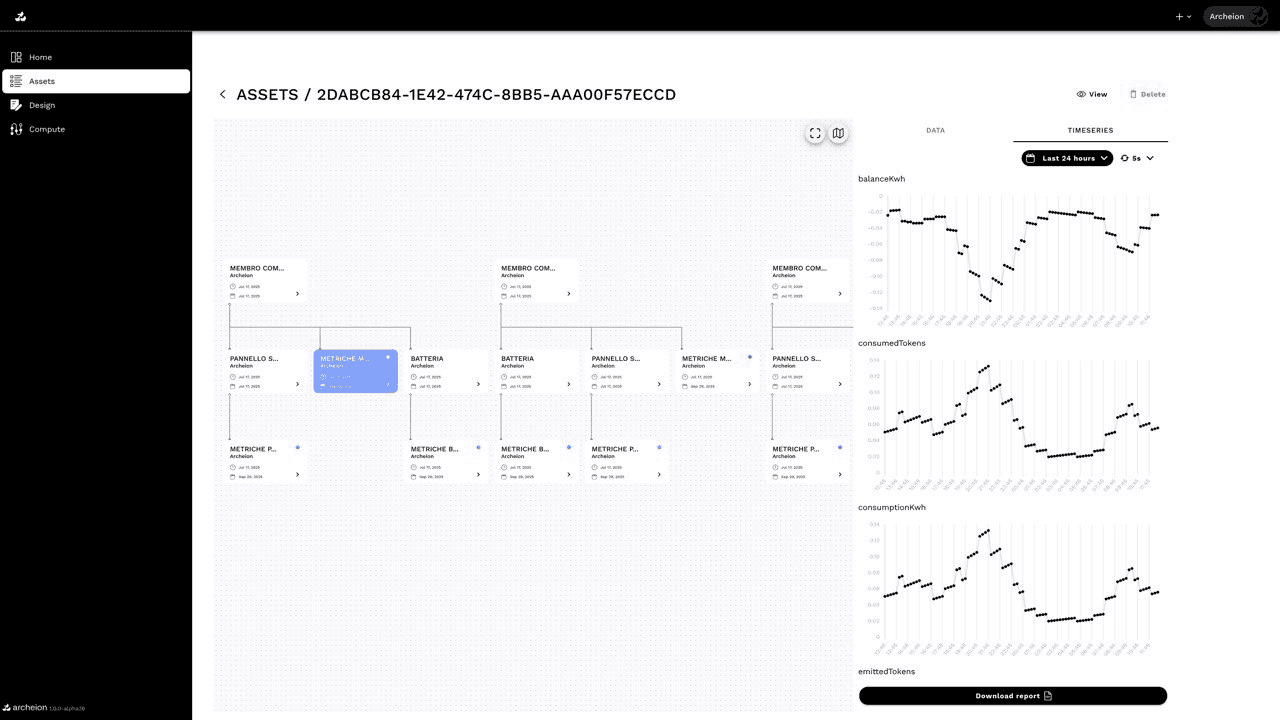
Our platform provides a clear and structured view of your assets and their performance. Through an intuitive tree-based interface, you can easily navigate between system components such as solar panels, batteries, and metric while maintaining full visibility over their interconnections. Dynamic time-series charts display real-time and historical data, including energy balance (kWh), consumption, and tokenized usage. This allows users to monitor performance trends, identify inefficiencies, and optimize energy management with precision. With just one click, you can download detailed reports, ensuring that critical insights are always at your fingertips. The combination of visual hierarchy and advanced analytics makes asset management simple, scalable, and actionable.
Our platform enables companies to create and manage a complete digital passport for each product, covering every stage of its lifecycle. From packaging details to manufacturing sites, recycled content, emissions, and compliance data, businesses can collect, organize, and share information in a structured way. Each screen, like the one dedicated to packaging, is part of a broader system that ensures transparency, sustainability, and regulatory alignment. With all product data accessible in one place, companies can streamline processes, demonstrate compliance, and build trust with customers and partners.


Synapsis breaks down silos and delivers connected insights, enabling faster strategic decisions and sustainable growth. Connect with our specialists to discover how data intelligence can take your organization to the next level.